Resistance of dough during the kneading process
data(flours)Format
flours is a list of 3 elements:
dataA matrix of size 241*115 containing the resistance of dough (measured every 2s) during the kneading process. One dough batch = 1 columnqualityQuality of cookies baked with the associated dough (1=Good, 2=Medium, 3=Bad)timetime values
Examples
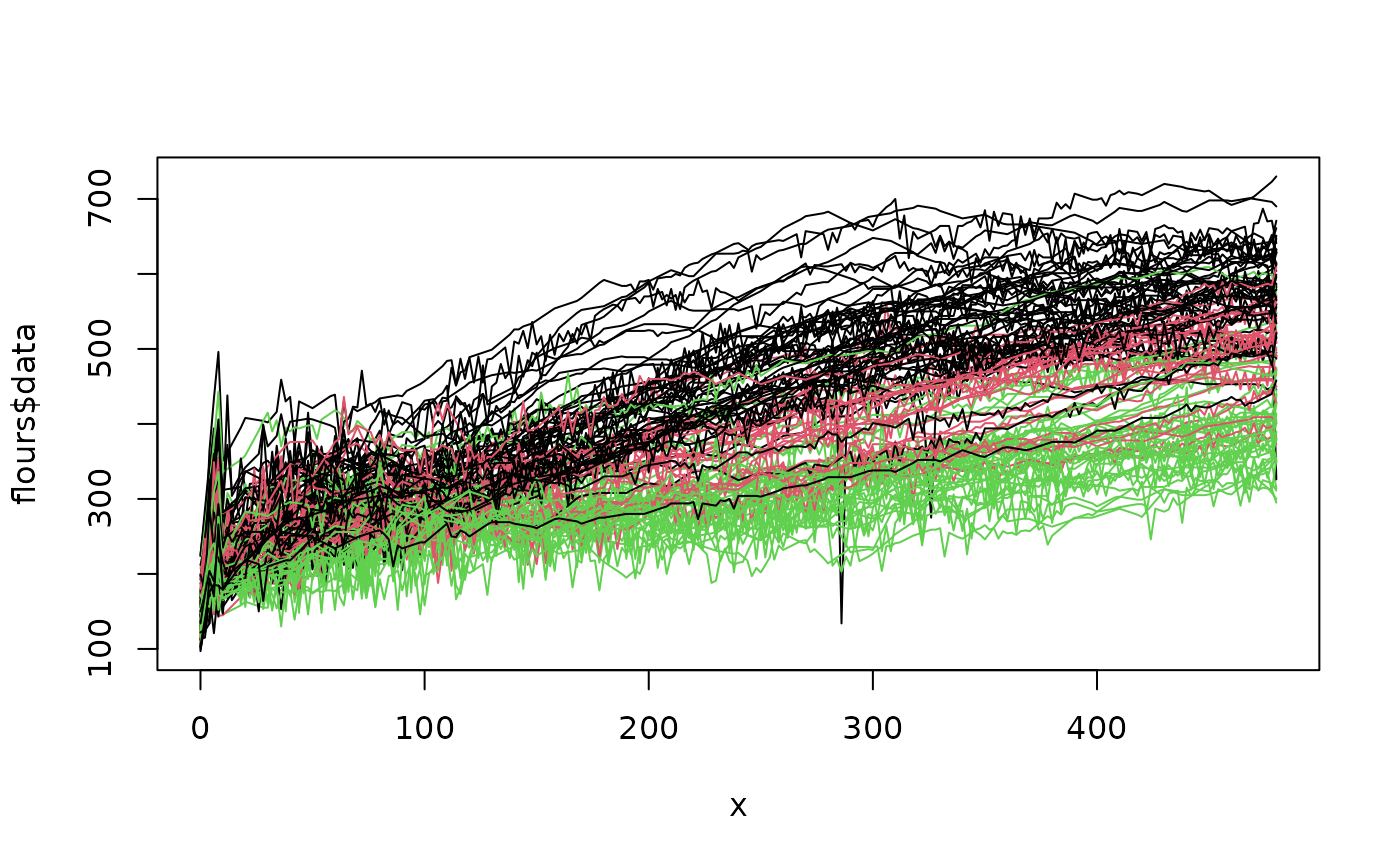
data(flours)
matplot(flours$time, flours$data, col = flours$quality, type = "l", lty = 1)
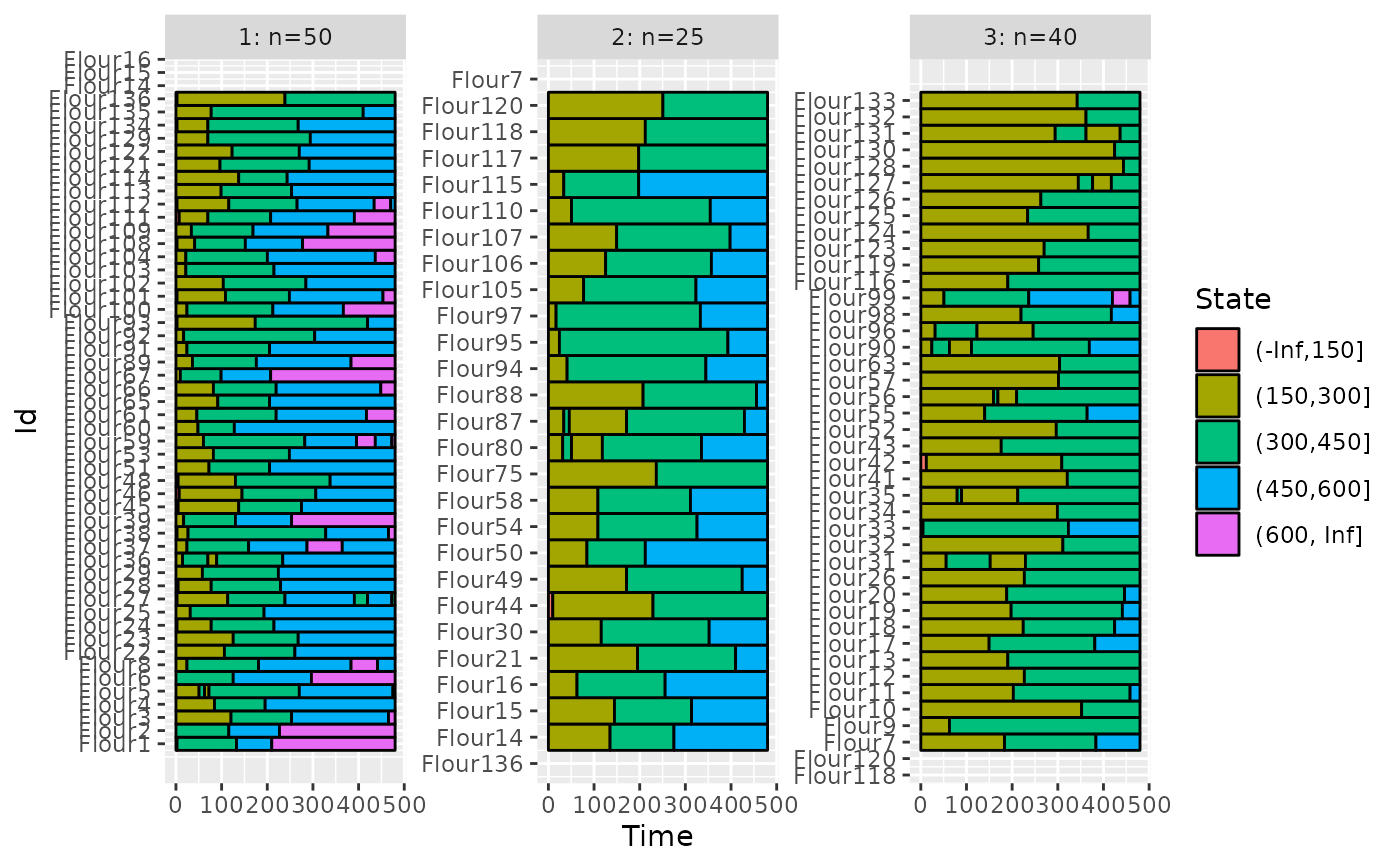
 # convert to categorical data
flours_cfd <- convertToCfd(flours$data,
breaks = c(-Inf, 150, 300, 450, 600, Inf),
times = flours$time
)
plotData(flours_cfd, group = flours$quality)
# convert to categorical data
flours_cfd <- convertToCfd(flours$data,
breaks = c(-Inf, 150, 300, 450, 600, Inf),
times = flours$time
)
plotData(flours_cfd, group = flours$quality)
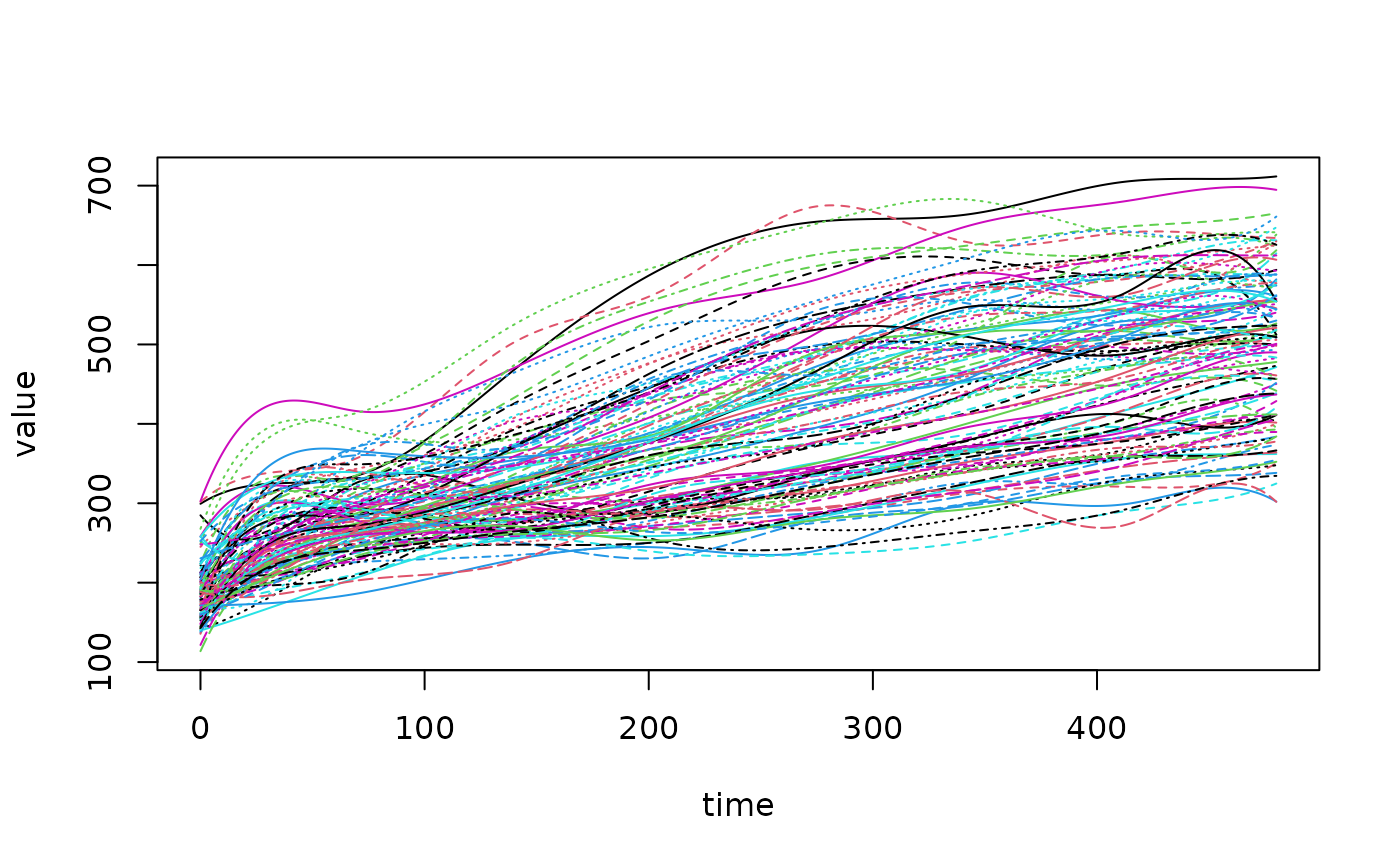
 # convert to categorical data after projecting in a basis of functions
basis <- create.bspline.basis(c(0, 480), nbasis = 10)
flours_fd <- Data2fd(flours$time, flours$data, basis)
plot(flours_fd)
# convert to categorical data after projecting in a basis of functions
basis <- create.bspline.basis(c(0, 480), nbasis = 10)
flours_fd <- Data2fd(flours$time, flours$data, basis)
plot(flours_fd)
 #> [1] "done"
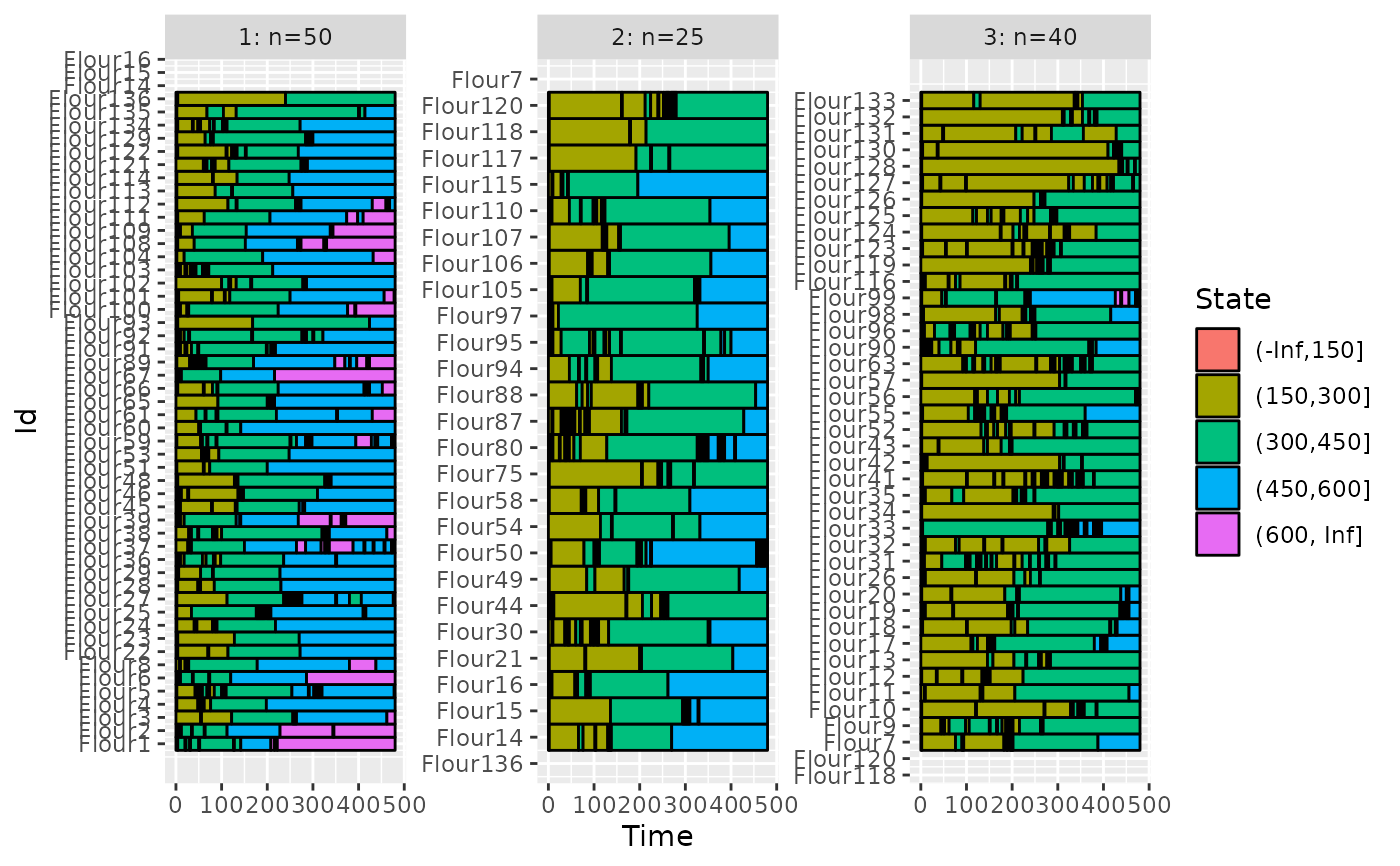
flours_cfd2 <- convertToCfd(flours_fd, breaks = c(-Inf, 150, 300, 450, 600, Inf))
plotData(flours_cfd2, group = flours$quality)
#> [1] "done"
flours_cfd2 <- convertToCfd(flours_fd, breaks = c(-Inf, 150, 300, 450, 600, Inf))
plotData(flours_cfd2, group = flours$quality)